Plot
The scrapenhl2.plot module contains methods useful for plotting.
Useful examples
First, import:
from scrapenhl2.plot import *
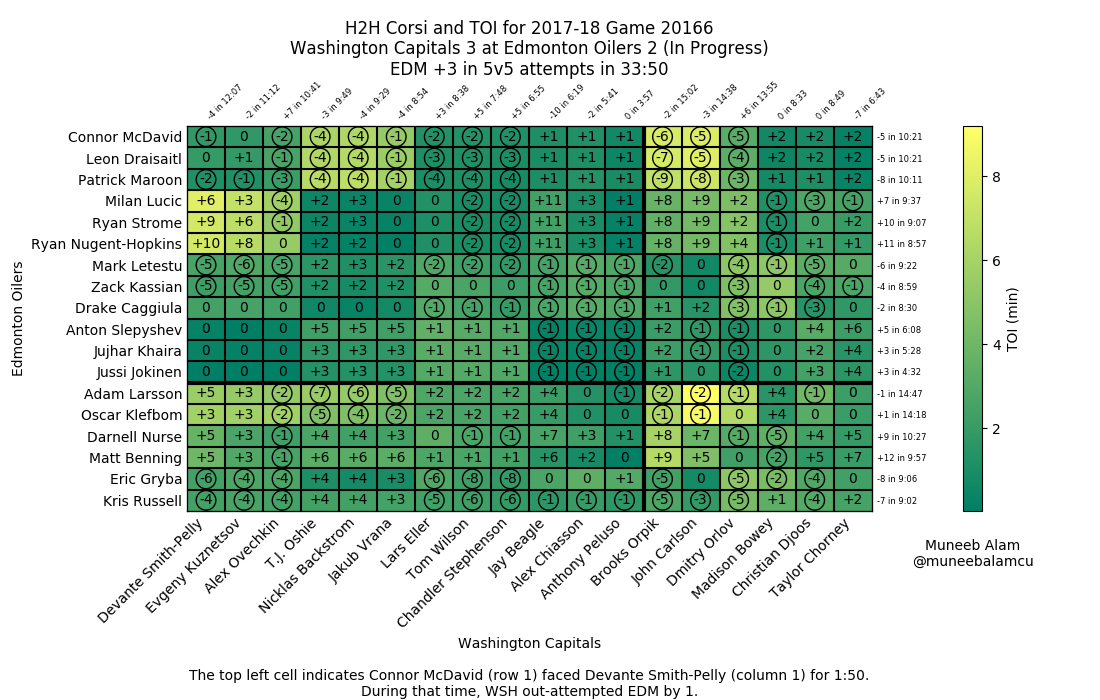
Get the H2H for an in-progress game:
live_h2h('WSH', 'EDM')
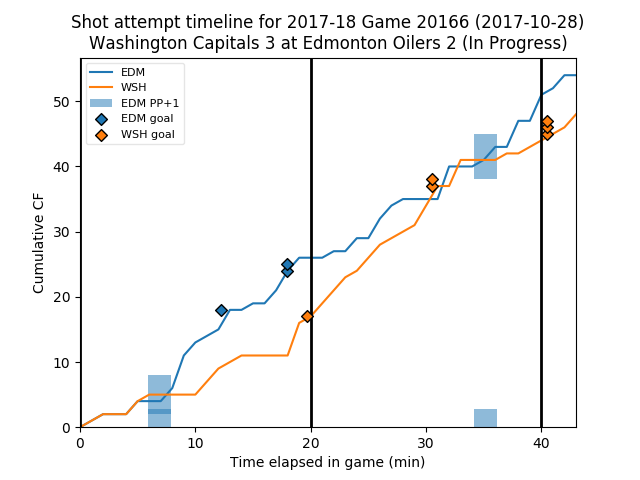
Get the Corsi timeline as well, but don’t update data this time:
live_timeline('WSH', 'EDM', update=False)
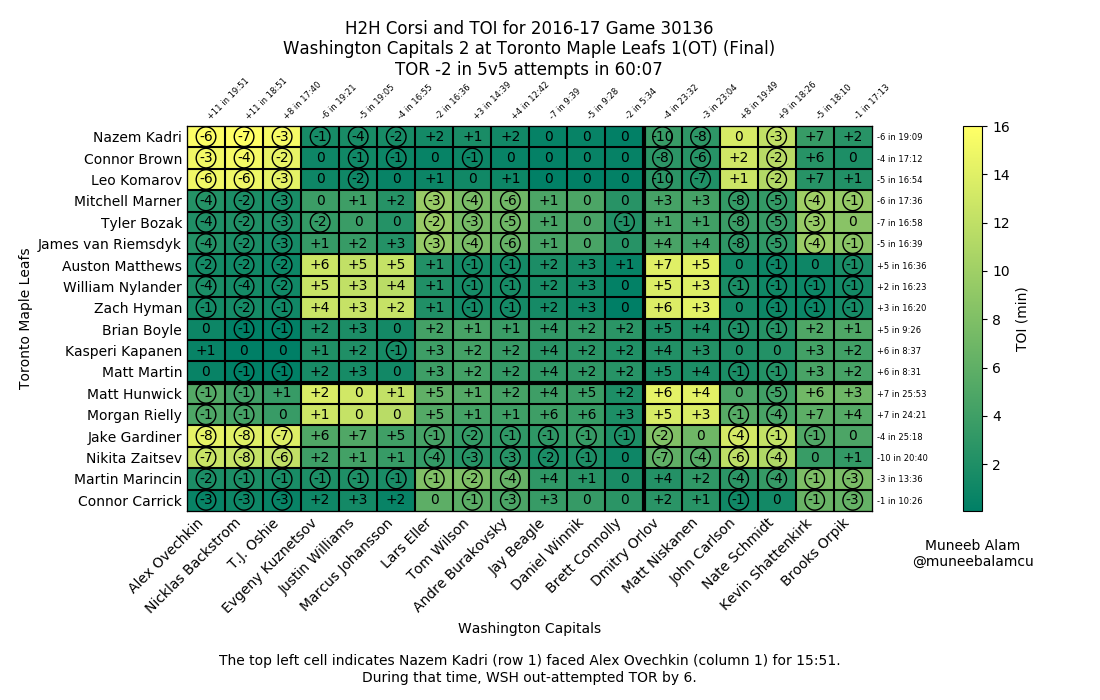
Save the timeline of a memorable game to file:
game_timeline(2016, 30136, save_file='/Users/muneebalam/Desktop/WSH_TOR_G6.png')
More methods being added regularly.
App
This package contains a lightweight app for browsing charts and doing some data manipulations.
Launch using:
import scrapenhl2.plot.app as app
app.browse_game_charts()
# app.browse_player_charts()
# app.browse_team_charts()
It will print a link in your terminal–follow it. The page looks something like this:
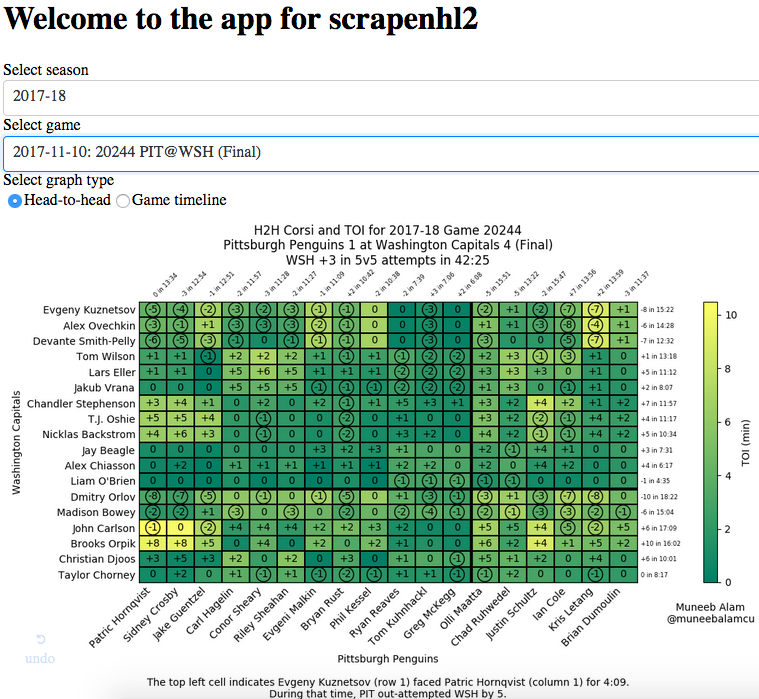
The dropdowns also allow you to search–just start typing.
Methods (games)
Game H2H
This module contains methods for creating a game H2H chart.
-
scrapenhl2.plot.game_h2h.game_h2h(season, game, save_file=None)¶ Creates the grid H2H charts seen on @muneebalamcu
Parameters: - season – int, the season
- game – int, the game
- save_file – str, specify a valid filepath to save to file. If None, merely shows on screen.
Returns: nothing
-
scrapenhl2.plot.game_h2h.live_h2h(team1, team2, update=True, save_file=None)¶ A convenience method that updates data then displays h2h for most recent game between specified tams.
Parameters: - team1 – str or int, team
- team2 – str or int, other team
- update – bool, should data be updated first?
- save_file – str, specify a valid filepath to save to file. If None, merely shows on screen.
Returns: nothing
Corsi timeline
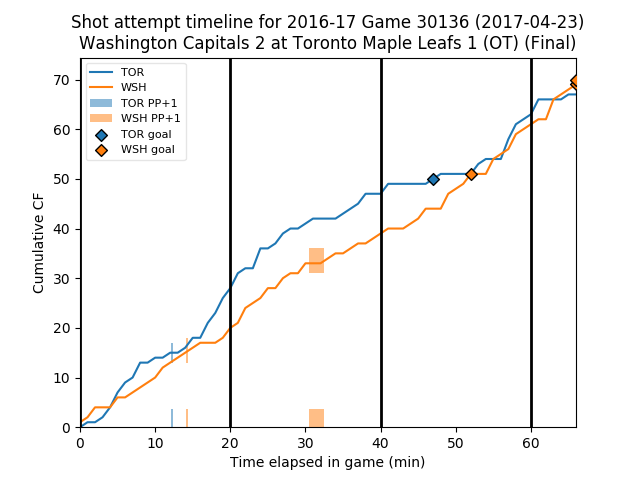
This module has methods for creating a game corsi timeline.
-
scrapenhl2.plot.game_timeline.game_timeline(season, game, save_file=None)¶ Creates a shot attempt timeline as seen on @muneebalamcu
Parameters: - season – int, the season
- game – int, the game
- save_file – str, specify a valid filepath to save to file. If None, merely shows on screen. Specify ‘fig’ to return the figure
Returns: nothing, or the figure
-
scrapenhl2.plot.game_timeline.get_goals_for_timeline(season, game, homeroad, granularity='sec')¶ Returns a list of goal times
Parameters: - season – int, the season
- game – int, the game
- homeroad – str, ‘H’ for home and ‘R’ for road
- granularity – can respond in minutes (‘min’), or seconds (‘sec’), elapsed in game
Returns: a list of int, seconds elapsed
-
scrapenhl2.plot.game_timeline.live_timeline(team1, team2, update=True, save_file=None)¶ A convenience method that updates data then displays timeline for most recent game between specified tams.
Parameters: - team1 – str or int, team
- team2 – str or int, other team
- update – bool, should data be updated first?
- save_file – str, specify a valid filepath to save to file. If None, merely shows on screen.
Returns: nothing
Methods (teams)
Team TOI by score
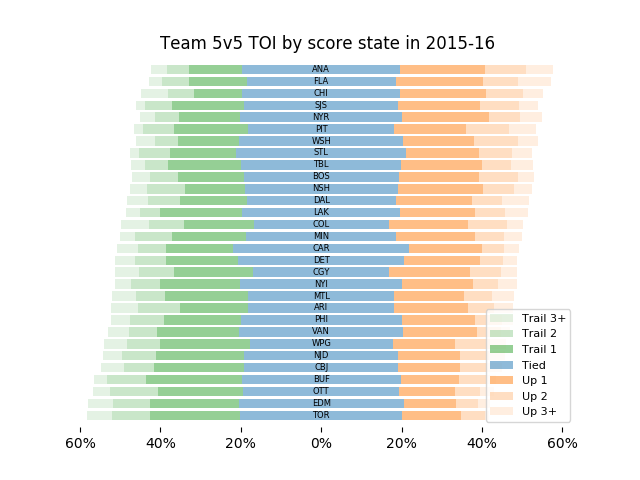
This module contains methods for making a stacked bar graph indicating how much TOI each team spends in score states.
-
scrapenhl2.plot.team_score_state_toi.get_score_state_graph_title(season)¶ Parameters: season – int, the season Returns:
-
scrapenhl2.plot.team_score_state_toi.score_state_graph(season)¶ Generates a horizontal stacked bar graph showing how much 5v5 TOI each team has played in each score state for given season.
Parameters: season – int, the season Returns:
Team lineup CF%
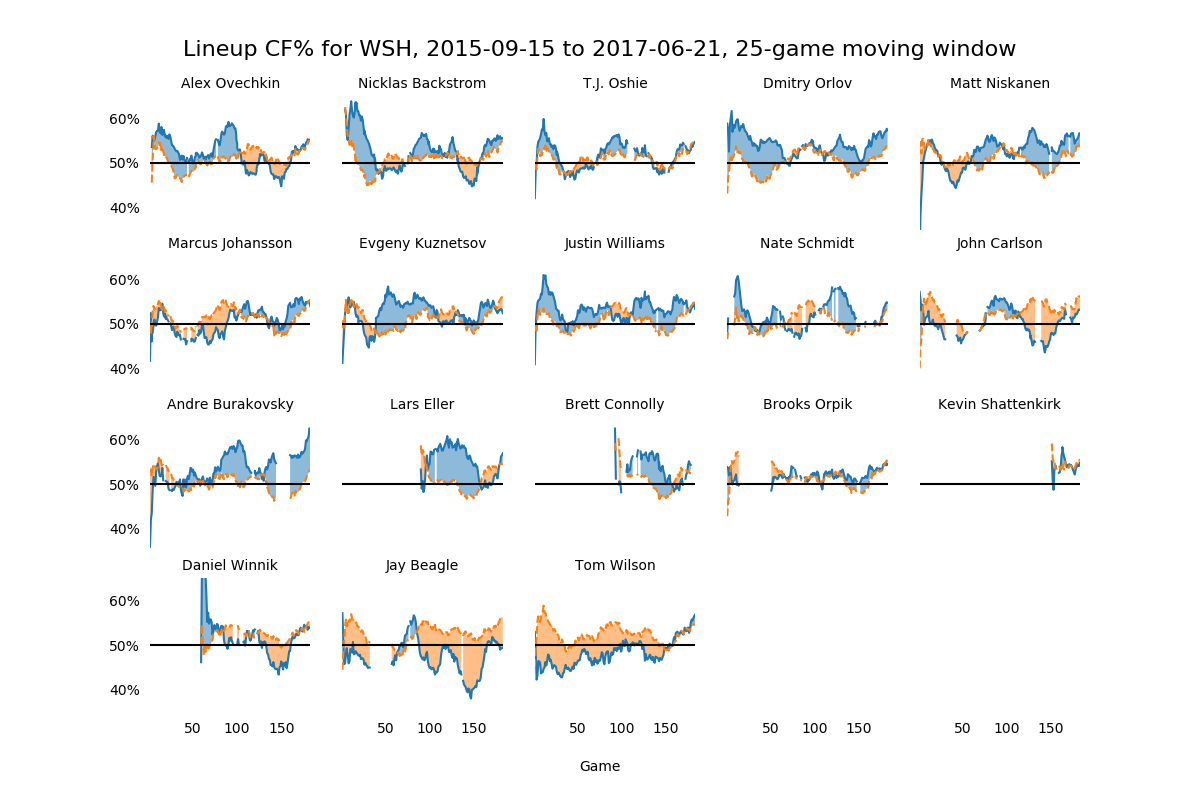
This module contains methods to generate a graph showing player CF%. 18 little graphs, 1 for each of 18 players.
-
scrapenhl2.plot.team_lineup_cf.team_lineup_cf_graph(team, **kwargs)¶ This method builds a 4x5 matrix of rolling CF% line graphs. The left 4x3 matrix are forward lines and the top-right 3x2 are defense pairs.
Parameters: - team – str or id, team to build this graph for
- kwargs – need to specify the following as iterables of names: l1, l2, l3, l4, p1, p2, p3. Three players for each of the ‘l’s and two for each of the ‘p’s.
Returns: figure, or nothing
Team shot rates by score
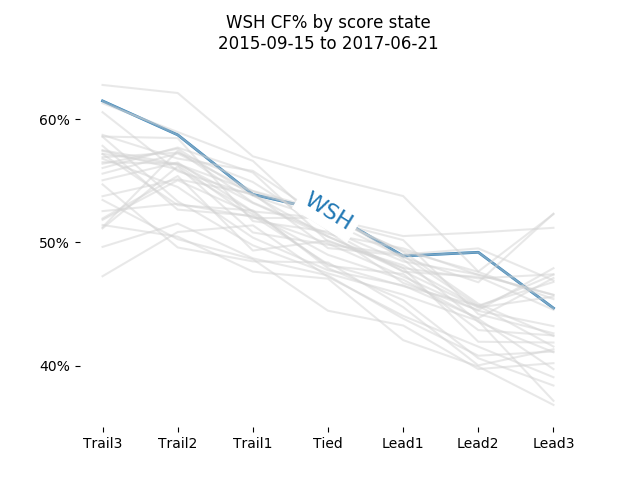
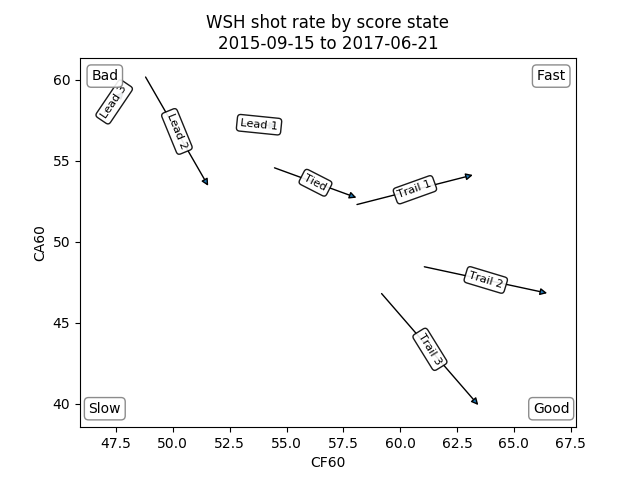
This module creates a scatterplot for specified team with shot attempt rates versus league median from down 3 to up 3.
-
scrapenhl2.plot.team_score_shot_rate.team_score_shot_rate_parallel(team, startseason, endseason=None, save_file=None)¶ Parameters: - team –
- startseason –
- endseason –
- save_file –
Returns:
-
scrapenhl2.plot.team_score_shot_rate.team_score_shot_rate_scatter(team, startseason, endseason=None, save_file=None)¶ Parameters: - team – str or int, team
- startseason – int, the starting season (inclusive)
- endseason – int, the ending season (inclusive)
Returns: nothing
Methods (individuals)
Player rolling CF and GF
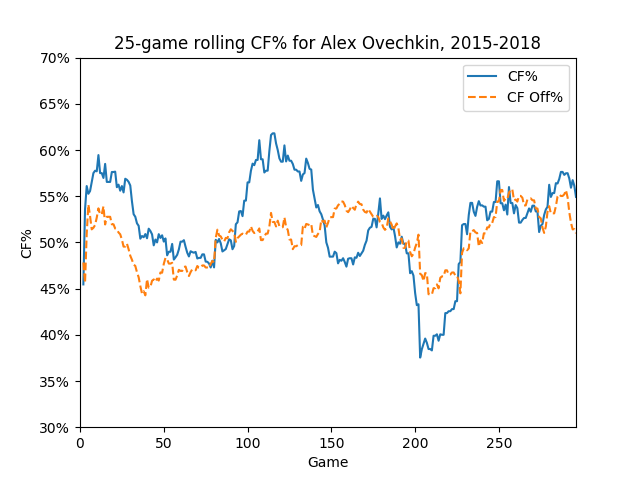
This module creates rolling CF% and GF% charts
-
scrapenhl2.plot.rolling_cf_gf.rolling_player_cf(player, **kwargs)¶ Creates a graph with CF% and CF% off. Defaults to roll_len of 25.
Parameters: - player – str or int, player to generate for
- kwargs – other filters. See scrapenhl2.plot.visualization_helper.get_and_filter_5v5_log for more information.
Returns: nothing, or figure
-
scrapenhl2.plot.rolling_cf_gf.rolling_player_gf(player, **kwargs)¶ Creates a graph with GF% and GF% off. Defaults to roll_len of 40.
Parameters: - player – str or int, player to generate for
- kwargs – other filters. See scrapenhl2.plot.visualization_helper.get_and_filter_5v5_log for more information.
Returns: nothing, or figure
Player rolling boxcars

This module contains methods for creating the rolling boxcars stacked area graph.
-
scrapenhl2.plot.rolling_boxcars.calculate_boxcar_rates(df)¶ Takes the given dataframe and makes the following calculations:
- Divides col ending in GFON, iA2, iA1, and iG by one ending in TOI
- Adds iG to iA1, calls result iP1
- Adds iG and iA1 to iA2, calls result iP
- Adds /60 to ends of iG, iA1, iP1, iA2, iP, and GFON
Parameters: df – dataframe Returns: dataframe with columns changed as specified, and only those mentioned above selected.
-
scrapenhl2.plot.rolling_boxcars.rolling_player_boxcars(player, **kwargs)¶ A method to generate the rolling boxcars graph.
Parameters: - player – str or int, player to generate for
- kwargs – other filters. See scrapenhl2.plot.visualization_helper.get_and_filter_5v5_log for more information.
Returns: nothing, or figure
Methods (individual comparisons)
Team D-pair shot rates

This module contains methods for creating a scatterplot of team defense pair shot rates.
-
scrapenhl2.plot.defense_pairs.drop_duplicate_pairs(rates)¶ The shot rates dataframe has duplicates–e.g. in one row Orlov is PlayerID1 and Niskanen PlayerID2, but in another Niskanen is PlayerID1 and Orlov is playerID2. This method will select only one, using the following rules:
- For mixed-hand pairs, pick the one where P1 is the lefty and P2 is the righty
- For other pairs, arrange by PlayerID. The one with the smaller ID is P1 and the larger, P2.
Parameters: rates – dataframe as created by get_dpair_shot_rates Returns: dataframe, rates with half of rows dropped
-
scrapenhl2.plot.defense_pairs.get_dpair_shot_rates(team, startdate, enddate)¶ Gets CF/60 and CA/60 by defenseman duo (5v5 only) for this team between given range of dates
Parameters: - team – int or str, team
- startdate – str, start date
- enddate – str, end date (inclusive)
Returns: dataframe with PlayerID1, PlayerID2, CF, CA, TOI (in secs), CF/60 and CA/60
-
scrapenhl2.plot.defense_pairs.team_dpair_shot_rates_scatter(team, min_pair_toi=50, **kwargs)¶ Creates a scatterplot of team defense pair shot attempr rates.
Parameters: - team – int or str, team
- min_pair_toi – int, number of minutes for pair to qualify
- kwargs – Use season- or date-range-related kwargs only.
Returns:
Usage
This module creates static and animated usage charts.
-
scrapenhl2.plot.usage.animated_usage_chart(**kwargs)¶ Parameters: kwargs – Returns:
-
scrapenhl2.plot.usage.parallel_coords_team_comparison(**kwargs)¶ Parameters: kwargs – Returns: nothing, or figure
-
scrapenhl2.plot.usage.parallel_usage_chart(**kwargs)¶ Parameters: kwargs – Defaults to take last month of games for all teams. Returns: nothing, or figure
Helper methods
This method contains utilities for visualization.
-
scrapenhl2.plot.visualization_helper.add_cfpct_ref_lines_to_plot(ax, refs=None)¶ Adds reference lines to specified axes. For example, it could add 50%, 55%, and 45% CF% lines.
50% has the largest width and is solid. 40%, 60%, etc will be dashed with medium width. Other numbers will be dotted and have the lowest width.
Also adds little labels in center of pictured range.
Parameters: - ax – axes. CF should be on the X axis and CA on the Y axis.
- refs – None, or a list of percentages (e.g. [45, 50, 55]). Defaults to every 5% from 35% to 65%
Returns: nothing
-
scrapenhl2.plot.visualization_helper.add_good_bad_fast_slow(margin=0.05, bottomleft='Slower', bottomright='Better', topleft='Worse', topright='Faster')¶ Adds better, worse, faster, slower, to current matplotlib plot. CF60 should be on the x-axis and CA60 on the y-axis. Also expands figure limits by margin (default 5%). That means you should use this before using, say, add_cfpct_ref_lines_to_plot.
Parameters: - margin – expand figure limits by margin. Defaults to 5%.
- bottomleft – label to put in bottom left corner
- bottomright – label to put in bottom right corner
- topleft – label to put in top left corner
- topright – label to put in top right corner
Returns: nothing
-
scrapenhl2.plot.visualization_helper.filter_5v5_for_player(df, **kwargs)¶ This method filters the given dataframe for given player(s), if specified
Parameters: - df – dataframe
- kwargs – relevant one is player
Returns: dataframe, filtered for specified players
-
scrapenhl2.plot.visualization_helper.filter_5v5_for_team(df, **kwargs)¶ This method filters the given dataframe for given team(s), if specified
Parameters: - df – dataframe
- kwargs – relevant one is team
Returns: dataframe, filtered for specified players
-
scrapenhl2.plot.visualization_helper.filter_5v5_for_toi(df, **kwargs)¶ This method filters the given dataframe for minimum or max TOI or TOI60.
This method groups at the player level. So if a player hits the minimum total but not for one or more teams they played for over the the relevant time period, they will be included.
Parameters: - df – dataframe
- kwargs – relevant ones are min_toi, max_toi, min_toi60, and max_toi60
Returns: dataframe, filtered for specified players
-
scrapenhl2.plot.visualization_helper.format_number_with_plus(stringnum)¶ Converts 0 to 0, -1 to -1, and 1 to +1 (for presentation purposes).
Parameters: stringnum – int Returns: str, transformed as specified above.
-
scrapenhl2.plot.visualization_helper.generic_5v5_log_graph_title(figtype, **kwargs)¶ Generates a figure title incorporating parameters from kwargs:
[Fig type] for [player, or multiple players, or team] [date range] [rolling window, if applicable] [TOI range, if applicable] [TOI60 range, if applicable]
Methods for individual graphs can take this list and arrange as necessary.
Parameters: - figtype – str brief description, e.g. Rolling CF% or Lineup CF%
- kwargs – See get_and_filter_5v5_log
Returns: list of strings
-
scrapenhl2.plot.visualization_helper.get_5v5_df_start_end(**kwargs)¶ This method retrieves the correct years of the 5v5 player log and concatenates them.
Parameters: kwargs – the relevant ones here are startseason and endseason Returns: dataframe
-
scrapenhl2.plot.visualization_helper.get_and_filter_5v5_log(**kwargs)¶ This method retrieves the 5v5 log and filters for keyword arguments provided to the original method. For example, rolling_player_cf calls this method first.
Currently supported keyword arguments:
- startseason: int, the season to start with. Defaults to current - 3.
- startdate: str, yyyy-mm-dd. Defaults to Sep 15 of startseason
- endseason: int, the season to end with (inclusive). Defaults to current
- enddate: str, yyyy-mm-dd. Defaults to June 21 of endseason + 1
- roll_len: int, calculates rolling sums over this variable.
- roll_len_days: int, calculates rolling sum over this time window
- player: int or str, player ID or name
- players: list of int or str, player IDs or names
- min_toi: float, minimum TOI for a player for inclusion in minutes.
- max_toi: float, maximum TOI for a player for inclusion in minutes.
- min_toi60: float, minimum TOI60 for a player for inclusion in minutes.
- max_toi60: float, maximum TOI60 for a player for inclusion in minutes.
- team: int or str, filter data for this team only
- add_missing_games: bool. If True will add in missing rows for missing games. Must also specify team.
Developer’s note: when adding support for new kwargs, also add support in _generic_graph_title
Parameters: kwargs – e.g. startseason, endseason. Returns: df, filtered
-
scrapenhl2.plot.visualization_helper.get_enddate_from_kwargs(**kwargs)¶ Returns 6/21 of endseason + 1, or enddate
-
scrapenhl2.plot.visualization_helper.get_line_slope_intercept(x1, y1, x2, y2)¶ Returns slope and intercept of lines defined by given coordinates
-
scrapenhl2.plot.visualization_helper.get_startdate_enddate_from_kwargs(**kwargs)¶ Returns startseason and endseason kwargs. Defaults to current - 3 and current
-
scrapenhl2.plot.visualization_helper.hex_to_rgb(value, maxval=256)¶ Return (red, green, blue) for the hex color given as #rrggbb.
-
scrapenhl2.plot.visualization_helper.insert_missing_team_games(df, **kwargs)¶ Parameters: - df – dataframe, 5v5 player log or part of it
- kwargs – relevant ones are ‘team’ and ‘add_missing_games’
Returns: dataframe with added rows
-
scrapenhl2.plot.visualization_helper.make_5v5_rolling_days(df, **kwargs)¶ Takes rolling sums based on roll_len_days kwarg. E.g. 30 for a ~monthly rolling sum.
Parameters: - df – dataframe
- kwargs – the relevant one is roll_len_days, int
Returns: dataframe with extra columns
-
scrapenhl2.plot.visualization_helper.make_5v5_rolling_gp(df, **kwargs)¶ Takes rolling sums of numeric columns and concatenates onto the dataframe. Will exclude season, game, player, and team.
Parameters: - df – dataframe
- kwargs – the relevant one is roll_len
Returns: dataframe with extra columns
-
scrapenhl2.plot.visualization_helper.make_color_darker(hex=None, rgb=None, returntype='hex')¶ Makes specified color darker. This is done by converting to rgb and multiplying by 50%.
Parameters: - hex – str. Specify either this or rgb.
- rgb – 3-tuple of floats 0-255. Specify either this or hex
- returntype – str, ‘hex’ or ‘rgb’
Returns: a hex or rgb color, input color but darker
-
scrapenhl2.plot.visualization_helper.make_color_lighter(hex=None, rgb=None, returntype='hex')¶ Makes specified color lighter. This is done by converting to rgb getting closer to 255 by 50%.
Parameters: - hex – str. Specify either this or rgb.
- rgb – 3-tuple of floats 0-255. Specify either this or hex
- returntype – str, ‘hex’ or ‘rgb’
Returns: a hex or rgb color, input color but lighter
-
scrapenhl2.plot.visualization_helper.parallel_coords(backgrounddf, foregrounddf, groupcol, legendcol=None, axis=None)¶ Parameters: - backgrounddf –
- foregrounddf –
- groupcol – For inline labels (e.g. initials)
- legendcol – So you can provide another groupcol for legend (e.g. name)
- axis –
Returns:
-
scrapenhl2.plot.visualization_helper.parallel_coords_background(dataframe, groupcol, axis=None)¶ Parameters: - dataframe –
- groupcol –
- axis –
- zorder –
- alpha –
- color –
- label –
Returns:
-
scrapenhl2.plot.visualization_helper.parallel_coords_foreground(dataframe, groupcol, axis=None)¶ Parameters: - dataframe –
- groupcol –
- axis –
- zorder –
- alpha –
- color –
- label –
Returns:
-
scrapenhl2.plot.visualization_helper.parallel_coords_xy(dataframe, groupcol)¶ Parameters: - dataframe – data in wide format
- groupcol – column to use as index (e.g. playername)
Returns: column dictionary, dataframe in long format
-
scrapenhl2.plot.visualization_helper.rgb_to_hex(red, green, blue)¶ Return color as #rrggbb for the given RGB color values.
-
scrapenhl2.plot.visualization_helper.savefilehelper(**kwargs)¶ Saves current matplotlib figure, or saves to file, or displays
Parameters: kwargs – searches for ‘save_file’. If not found or None, displays figure. If ‘fig’, returns figure. If a filepath, saves. Returns: nothing, or a figure
This module is from SO. It adds labels for lines on the lines themselves.
-
scrapenhl2.plot.label_lines.labelLine(line, x, label=None, align=True, **kwargs)¶ Labels line with line2D label data
-
scrapenhl2.plot.label_lines.labelLines(lines, align=True, xvals=None, **kwargs)¶ Labels lines in a line graph